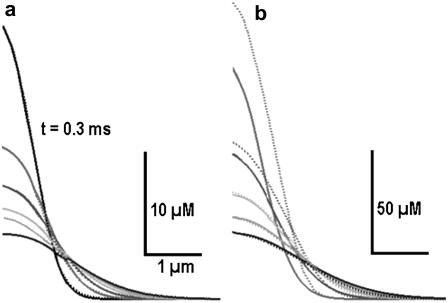
FIGURE 2.
Exact Ca2+ transients and their approximation. Time-dependent Ca2+ concentration profiles obtained by numerical integration of reaction-diffusion system using the Crank-Nicolson algorithm (dotted curves) are approximated by the analytical solution for the logarithmic diffusion (solid curves). The diffusion coefficients were DCa = 200 μm2/s, dBuffer = 20 μm2/s, the on- and off-rate constants were kon = 108 M−1s−1 and koff = 100 s−1 (Kd = 1 μM), and the total buffer concentration Bo = 1 mM. For the logarithmic diffusion the apparent diffusion coefficient Δ was 40 μm2/s. In panel b the amplitude of instantaneous Ca2+ source was seven times bigger than in panel a. Note a close correspondence between the two solutions (a) and underestimation of the large amplitude transients in the case of the logarithmic diffusion (b).

