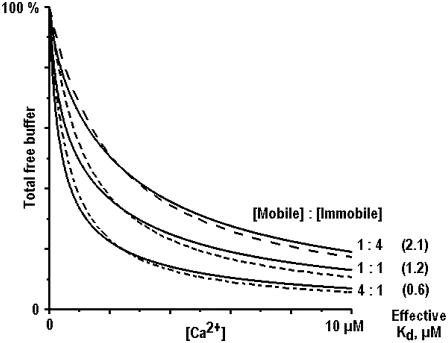
FIGURE 4.
Effective dissociation constants in mixtures of mobile and immobile Ca2+ buffers. Solid traces indicate the Ca2+ binding capacity in the presence of two buffers with dissociation constants equal to 0.3 and 3 μM (see Appendix III). The dotted curves approximate the data by assuming the same dissociation constant for both buffers. Its values are given in parentheses (right of the curves) and depend on the mol ratio.

