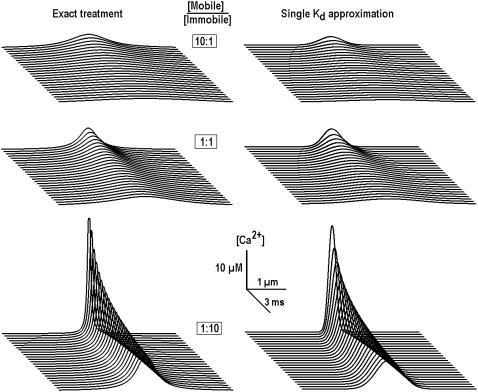
FIGURE 5.
Ca2+ transients in the presence of mobile and immobile Ca2+ buffers of different affinity. The panels show Ca2+ transients at different buffer mol ratios as indicated. The total buffer concentration was 1 mM, the dissociation constants of the mobile and the immobile buffers were 0.3 μM and 3 μM, respectively, and the diffusion coefficient for the mobile buffer was 20 μm2/s. The profiles in the left column were obtained by explicitly considering the effects of two buffers (Eq. 14). The profiles in the right column show the transients calculated by using effective dissociation constants (Fig. 4) and diffusion coefficients (Eq. 10), which both depended on the mol ratio. Note a close correspondence between the transients in the two sets of data.

