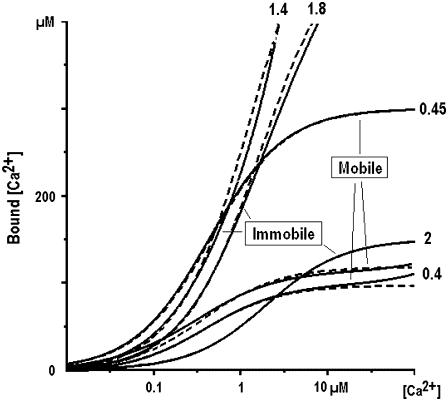
FIGURE 9.
Binding capacity of cytoplasmic Ca2+ buffers and its approximation. The graphs are based on the representative literature data listed in Table 1. The amount of bound Ca2+ in the mixtures of mobile and immobile Ca2+ buffers is shown by continuous lines as indicated. The traces are approximated by considering only one buffer with the effective dissociation constants indicated near each curve.

