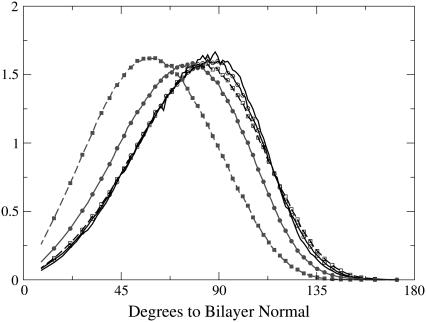
FIGURE 7.
Distribution of the angle between the phosphorus-to-nitrogen vector and the bilayer normal for each of the leaflets; the normal is directed out of the bilayer. Charged lidocaine, lines with solid symbols; uncharged, lines with open symbols; 12 lidocaines, lines with circles; 36 lidocaines, lines with squares; reference system, line without symbols.

