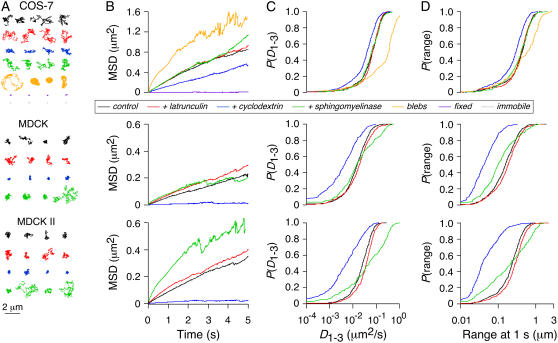
FIGURE 2.
SPT analysis of AQP1 at high time resolution (91 Hz). (A) Representative trajectories for AQP1 diffusing in the plasma membrane of COS-7 (top), MDCK (middle), and MDCK II (bottom) cells shown under control conditions (black), and after treatment with latrunculin (red), cyclodextrin (blue), or sphingomyelinase (green). For COS-7 cells, trajectories are also shown for paraformaldehyde-fixed cells (purple) and on the surface of membrane blebs (orange). Trajectories for Qdots immobilized on glass are shown for comparison (gray). (B) Corresponding combined MSD versus time curves for each cell type/maneuver shown. Cumulative probability distributions shown for AQP1 diffusion coefficient, D1-3 (C), and range at 1 s (D).

