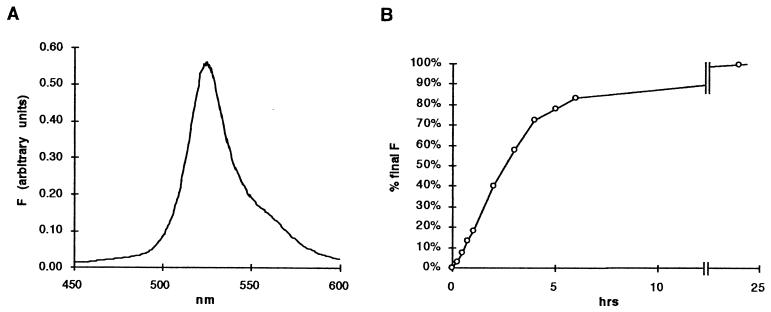
Figure 1.
GFP fluorescence measured in cell suspensions. Cultures were grown and samples were prepared as described in Materials and Methods. (A) Emission spectrum for cells containing pDS439 (ParaBAD-GFPmut2) after growth for 6 hr in the presence of 1.33 mM arabinose. The excitation wavelength used was 420 nm. Fluorescence is expressed in arbitrary units. (B) Induction kinetics after addition of arabinose to 1.33 mM.

