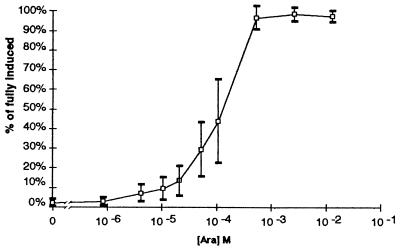
Figure 3.
Dependence of GFP levels on inducer concentration. Cultures were grown in the presence of the indicated concentrations of arabinose for 5 hr as described in Materials and Methods. Fluorescence was measured on suspensions of intact cells as in Fig. 1. Data shown are the average values for three independent experiments. Error bars indicate one SD above and below the average values at each inducer concentration.

