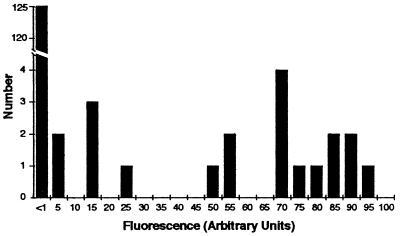
Figure 5.
Histogram of the fluorescence intensities of cells in the low arabinose (106 μM) culture. Fluorescence intensities of 145 cells were quantitated based on scanned photomicrographs as described in Materials and Methods and are expressed in arbitrary units. Due to day-to-day fluctuations in lamp intensity, the units in this figure cannot be directly compared with the values shown in Fig. 2.

