
Figure 1.
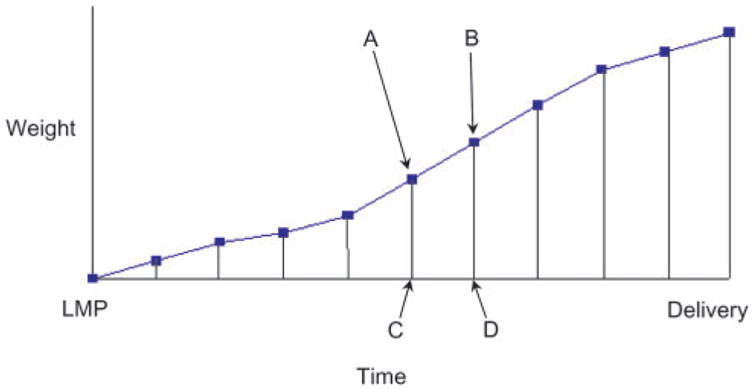
Schematic diagram of gestational weight gain. The x-axis represents time, beginning with the date of the last menstrual period (LMP), the y-axis represents weight, beginning with weight at LMP. The squares represent weights measured during pregnancy, with vertical lines intersecting the date of the measurement. Trapezoids are formed between successive measured weights, e.g. A, B and the corresponding values on the x-axis, e.g. C, D. The area under the curve is calculated by summing all such trapezoids