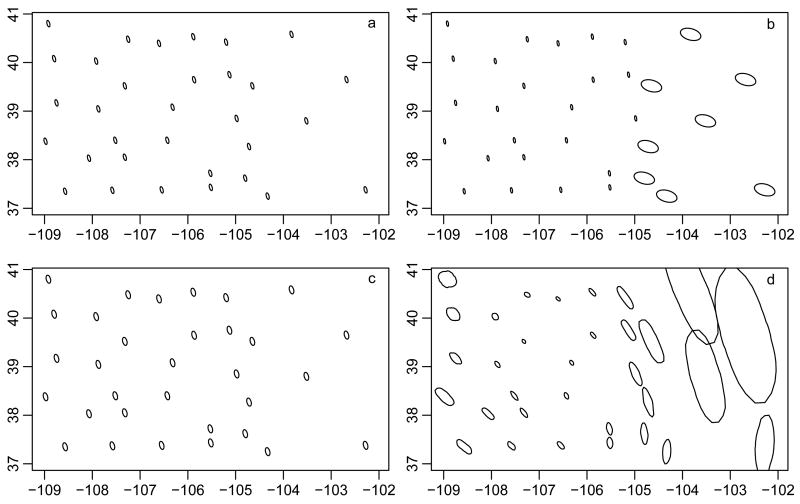
Figure 4.
Kernels (ellipses of constant probability density of Gaussian densities) representing the estimated correlation structure for (a) stationary kriging, (b) nonstationary kriging based on two regions, (c) the fully Bayesian stationary GP model, and (d) the nonstationary GP model. For the Bayesian models, the ellipse-like figures are the posterior means of constant probability density ellipse values at a sequency of angles, 0,…,2π.

