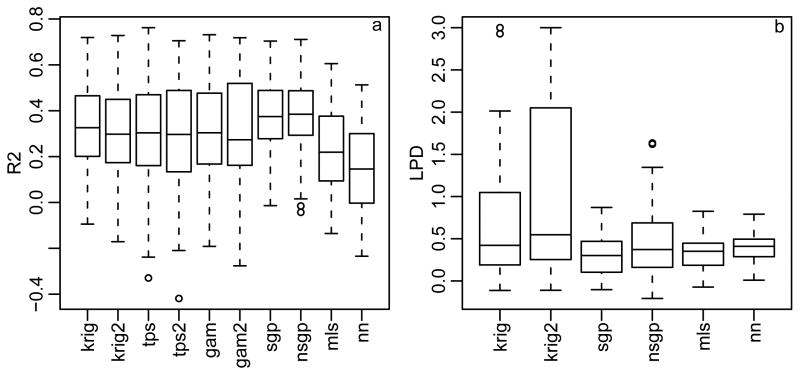
Figure 5.
(a) Test R2 and (b) log predictive density (LPD) for the methods (labels indicated in Section 4.3) on 47 years of Colorado precipitation for test locations within the convex hull of the training data. Values of LPD larger than 3 are not plotted. Methods with a ‘2’ in their label (krig2, tps2, gam2) were fit separately to eastern and western Colorado.

