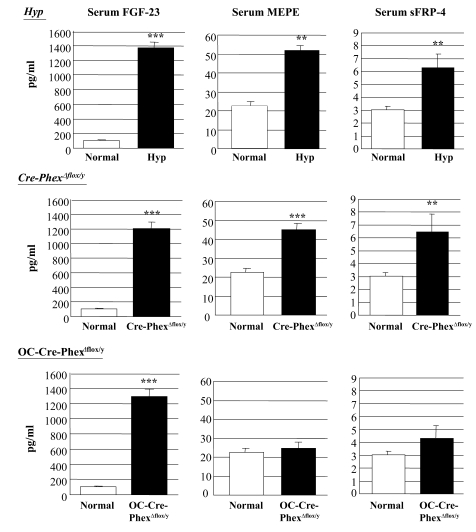
Figure 7. Serum phosphatonin levels in normal, hyp-, OC-Cre-PhexΔflox/y, and Cre-PhexΔflox/y mice.
ELISA measurements of serum FGF-23, MEPE, and sFRP-4 levels demonstrated that all 3 phosphatonins were increased in hyp- and Cre-PhexΔflox/y mice. However, serum FGF-23, but not MEPE or sFRP-4, was increased in OC-Cre-PhexΔflox/y mice. **P < 0.01, ***P < 0.001 compared with corresponding normal mice.

