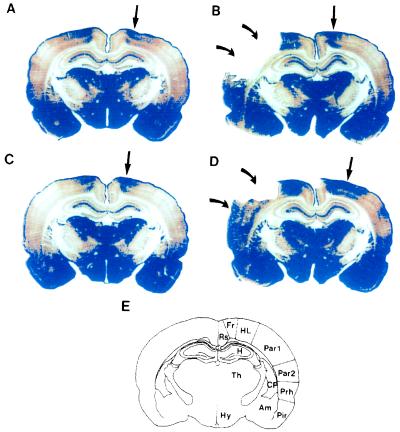
Figure 3.
Changes in GAP-43 IR in posterior brain sections following bFGF treatment. Representative sections are from sham/vehicle-treated animals (A), stroke/vehicle-treated animals (B), sham/bFGF-treated animals (C), and stroke/bFGF-treated animals (D). Animals were killed 3 days after surgery. The blue color shows regions of “high” GAP-43 IR (see legend to Fig. 2). Curved arrows point to cerebral infarcts. In B, all necrotic tissue has fallen off the slide; in D, some infarcted tissue remains (lower curved arrow), but is necrotic as determined by H&E staining of adjacent sections. (E) Schematic diagram of brain regions. Rs, retrosplenial cortex; FR, frontal cortex, areas 1 and 2; HL, hindlimb area; Par1 and -2, parietal cortex, areas 1 and 2; Prh, perirhinal cortex; Pir, piriform cortex; Am, amygdala; CP, caudoputamen; CC, corpus callosum; H, hippocampus; Th, thalamus; Hy, hypothalamus. In all sham-operated animals (A and C) and in stroke/vehicle-treated animals (B), high GAP-43 IR is restricted to HL in the dorsolateral cortex (straight arrows). However, in stroke/bFGF-treated animals (D), the region of high GAP-43 IR spreads to involve Par1.

