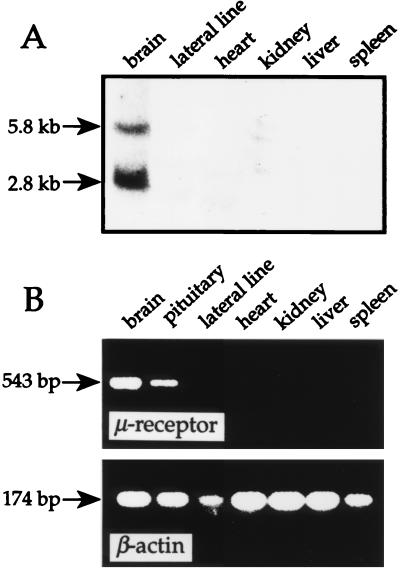
Figure 6.
Tissue expression of the C. commersoni μ-opioid receptor gene. Shown are the results of a Northern blot analysis (A) and an RT-PCR experiment (B). The numbers on the left indicate the estimated transcript sizes (A) and the amplified cDNA fragment sizes (B). For details, see Materials and Methods.

