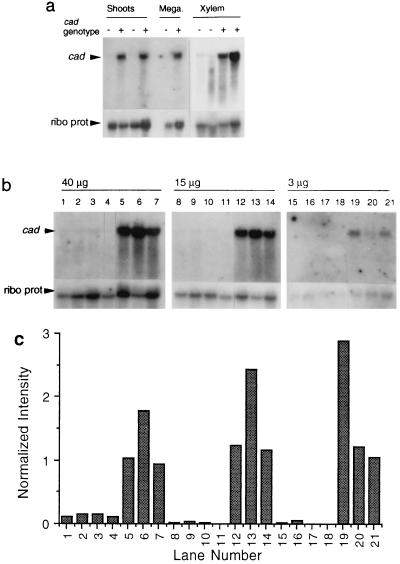
Figure 5.
Northern analyses of steady-state cad message. (a) RNA blots probed with cad (Upper) and a pine ribosomal protein cDNA (Lower). Samples are total RNA (shoot tips, 10 μg; others, 5 μg) from homozygous or haploid cad-n1 (−) and wild-type (+) genotypes. (b) Total RNAs (40 μg, 15 μg, or 3 μg) from four cad-n1 (lanes 1–4, 8–11, and 15–18) and three wild-type homozygotes (lanes 5–7, 12–14, and 19–21). (c) Histogram of the cad hybridization signal normalized against the ribosomal protein signal for each lane of b.

