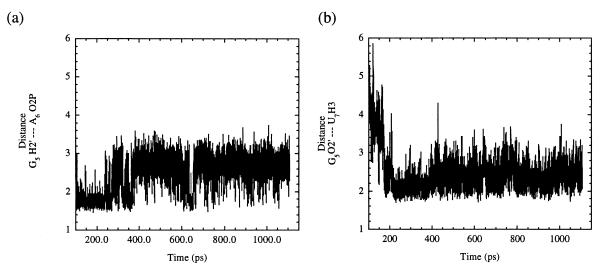
Figure 3.
(a) A plot of the hydrogen bond that developed during the simulation time between the H2′ of residue G5 and O2P of residue A6. The average distance between these two atoms was calculated to be 2.45 Å. (b) A plot of the hydrogen bond that developed between atom O2′ of residue G5 and the H3 of residue U7. These two hydrogen bonds are believed to assist in maintaining the sharp bend in the substrate strand of this hammerhead ribozyme.

