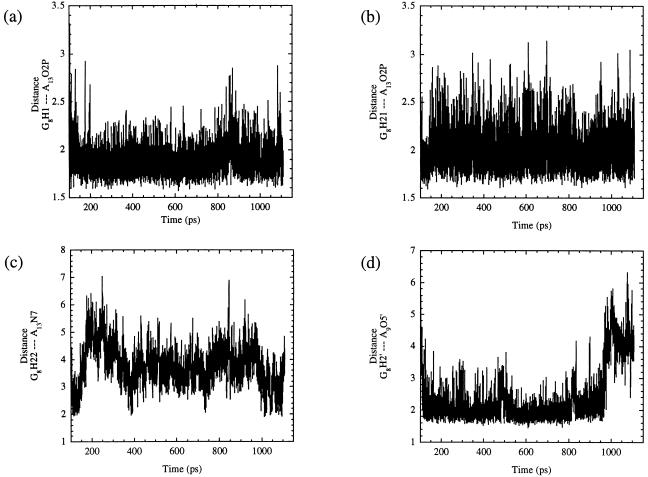
Figure 5.
This figure shows plots of the hydrogen bonding interactions associated with residue G8. a and b show the distances of the bifurcated hydrogen bond that formed between O2P of residue A13 and the H1 and the H21 of residue G8 with average distances of 1.89 Å and 2.00 Å, respectively. (c) A plot of the hydrogen bond that occurred between H22 of residue G8 and N7 of residue A13. The shortest distances between these two atoms correspond with the formation of NACs. (d) Plot of the hydrogen bond between the H2′ of residue G8 and the O5′ of residue A9. The average distance between these two atoms is 2.39 Å.

