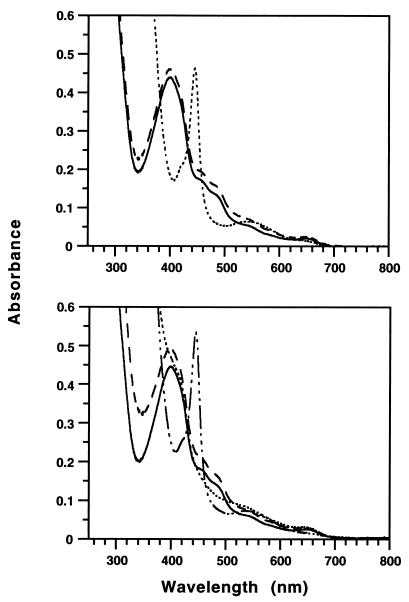
Figure 5.
Electronic absorption spectra of iNOS in the presence of iron and copper. All spectra were recorded at 10°C and the concentration of iNOS was ≈5 μM. (Upper) Effect of the addition of iron: (—) iNOS as isolated; (— —) iNOS after the addition of 30 μM FeCl2 (- - -) iNOS after the subsequent addition of CO and NADPH (200 μM). (Lower) Effect of the addition of copper: (—) iNOS as isolated; (— —) iNOS after the addition of CuCl2 to 100 μM; (- - -) iNOS after the subsequent addition of CO and NADPH (200 μM); and (— - - - —) iNOS mixture (iNOS, Cu, CO, NADPH) after the addition of dithionite.

