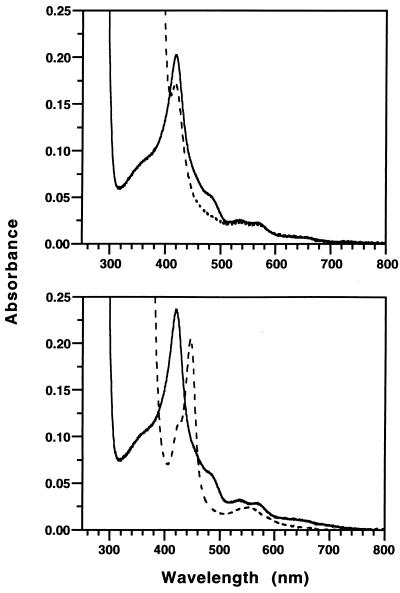
Figure 6.
Electronic absorption spectra of the H652A mutant of nNOS. All spectra were recorded at 10°C and the concentration of nNOS H652A was ≈3 μM. (Upper) The H652A mutation results in an inhibition of NADPH-dependent heme reduction: (– – –) is H652A as isolated and (—) is H652A after the equilibration with CO and subsequent addition of NADPH (200 μM). (Lower) H652A as isolated (—) and H652A after the equilibration with CO and subsequent addition of dithionite (– – –).

