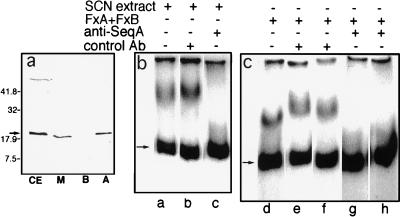
Figure 2.
Effect of anti-SeqA antibody. (a) Anti-SeqA immunoblot analysis was performed on samples of cell extract (CE), membrane (M), fraction A (A), and fraction B (B). The amount of each sample applied to the gel corresponded to the amount of cell extract applied to the first lane to permit recoveries in each fraction to be estimated directly from the intensities of the SeqA bands. The arrow indicates the position of purified SeqA that was run on the same gel and stained with Coomassie brilliant blue. The band in the upper portion of the gel represents a cross-reacting component present in cell envelope preparations. The positions of molecular mass standards, expressed in kDa, are indicated on the left. (b and c) Gel retardation assays were performed on the KSCN extract (8 ng/μl, lanes a–c) or on a mixture of fraction A (Fx A, corresponding to 3 ng/μl of KSCN extract) and fraction B (Fx B, corresponding to 12 ng/μl of KSCN extract) (lanes d–h). Anti-SeqA antibody (lanes c, g, and h) or normal rabbit serum (lanes b, e, and f) was added to the sample to be assayed, in the assay buffer, and allowed to stand for 30 min at 4°C before being added to the assay mixture. Antisera were present at dilutions of 1:10 (lanes e and g) or 1:20 (lanes b, f, and h).

