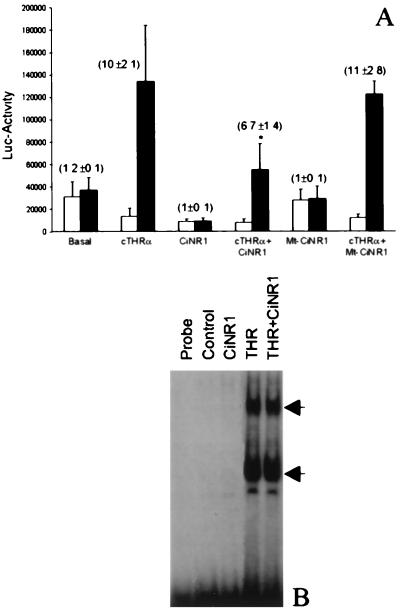
Figure 5.
Transcriptional activity and DNA binding of CiNR1. (A) Dominant negative activity of CiNR1. COS7 cells were transfected with 1 μg of TR, 6 μg of CiNR1, 1 μg of TR, and 6 μg of CiNR1, or 1 μg of TR and 6 μg of Mt-CiNR1 in presence (■) or in absence (□) of 10−7M T3. The luciferase activity was measured in the corresponding cell extracts and was normalized with respect to CAT activity. The figure shows the mean ± SD of three determinations. Values in parentheses are folds of stimulation by T3. P < 0.01 is compared with cTRα alone. (B) DNA binding of TRα and CiNR1. An equal amount (4 μg) of COS7 extracts transfected with empty-plasmid (control), pSG5TRα, or pSG5CiNR1 was used for binding reactions with ≈0.5 ng of 32P-labeled PAL-oligonucleotide. Arrows indicate specific complexes.

