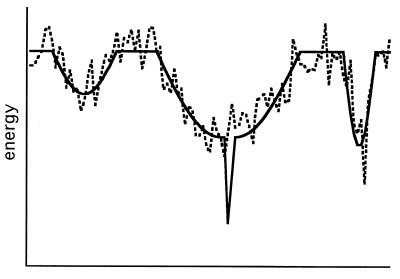
Figure 1.
Schematic diagram of a hypothetical folding energy landscape. The x axis corresponds to a generalized structure coordinate (17, 26). The solid line corresponds to the internal free energy (17), and the dashed line corresponds to the value of a database-derived scoring function such as the one used in this work. The scoring function follows the true potential because it is sensitive to hydrophobic burial but produces noise and fails to detect the sharp drop in energy of the native state because of inaccuracies in quantifying hydrogen bonds, electrostatic, and van der Waals interactions. However, the scoring function is able to detect the higher density of low-energy states in the broad region surrounding the native state.

