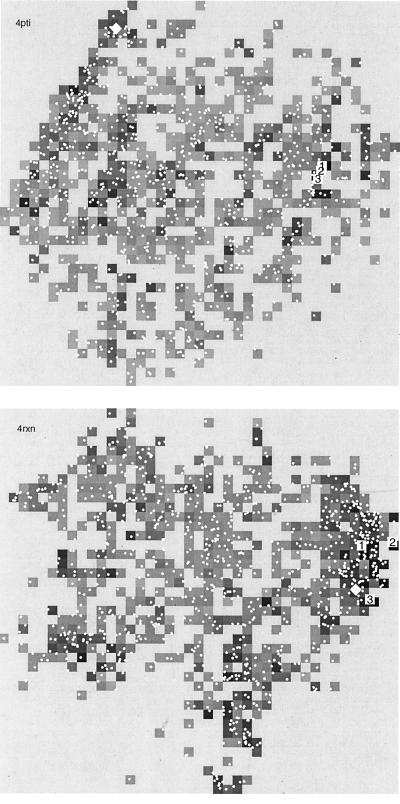
Figure 3.
Multidimensional scaling maps of the ensemble of conformations in the Park–Levitt sets of conformations for 4pti (Upper) and 4rxn (Lower). The distance in rmsd between each pair of conformations is projected onto two dimensions, retaining relative distance relationships so that two structurally similar conformations tend to be located near each other. The position of each conformation is indicated by a small white dot. The position of the native state is marked with a white diamond, and the three conformations with three lowest (best) energy scores are marked with white boxes. The gray scale value of each pixel is determined by the lowest energy conformation within that small region of the map, with black being the very lowest energies.

