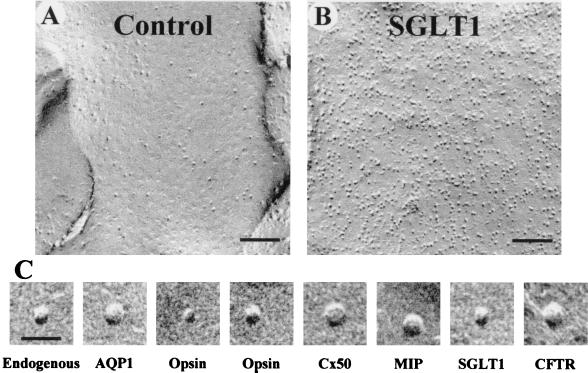
Figure 1.
P face freeze-fracture micrographs of the plasma membrane of X. laevis oocytes. (A) The P face of control oocytes shows a low density of particles at 355 ± 21/μm2 (n = 2,130). (B) In an oocyte expressing SGLT1, the density of the particles increased to 3,287 ± 112/μm2 (n = 2,565). (C) High-magnification representative images of endogenous P face particles, AQP1, the short axis of opsin, the long axis of opsin, Cx50, MIP, SGLT1, and CFTR. [Bars = 100 nm (A and B) and 20 nm (C).]

