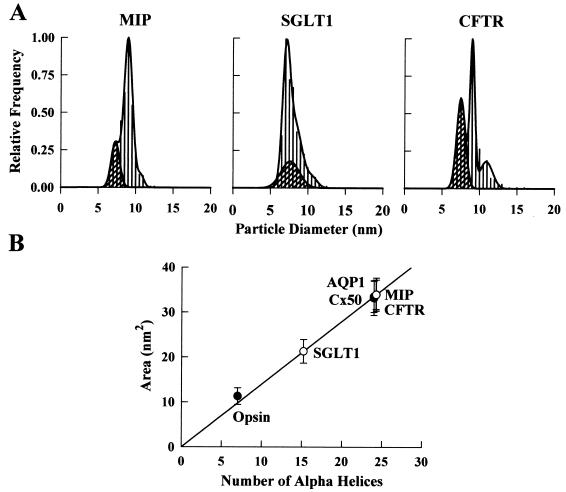
Figure 4.
Size distribution of P face particles in oocytes expressing MIP, SGLT1, and CFTR. (A) MIP particles demonstrated a single population at 9.0 ± 0.3 nm (N = 430). The particle density in this oocyte was 3,288 ± 136/μm2 (n = 2,878). SGLT1 particles appeared at 7.1 ± 0.2 (48%) and 8.2 ± 0.4 nm (52%) (N = 640). In this oocyte, the particle density was 2,070 ± 130/μm2 (n = 2,163). CFTR particles were 9.0 ± 0.2 nm in diameter (N = 500). A larger particle (11.0 ± 0.8 nm) appeared in the CFTR frequency histogram that coincides with the larger endogenous particles but was present at a higher relative frequency (≈10% of exogenous particles). Particle density was 678 ± 27/μm2 (n = 944). Cross-hatched regions correspond only to the 7.6-nm P face endogenous particles as confirmed by particle density determinations. (B) Relationship between the transmembrane domain cross-sectional area and the number of transmembrane α-helices. The straight line corresponds to the linear regression through the AQP1, opsin, and Cx50 data (•) (slope, 1.40 ± 0.03 nm2/helix). ○, Calculated cross-sectional areas of MIP, SGLT1, and CFTR.

