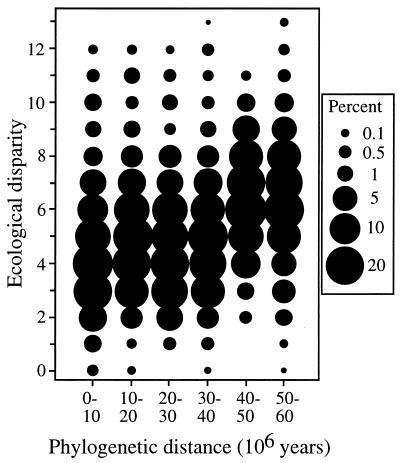
Figure 3.
Primate ecological disparity as a function of phylogenetic distance. The size of each dot represents the relative frequency of a particular ecological disparity value (plotted as rounded euclidean distance) for each phylogenetic distance category (as 10 million-yr intervals). Note the similar ecological disparities until more than 40 million-yr-old primate lineages and relatively high frequency of very disparate (disparity >10) primates among phylogenetically young lineages. The ecological disparity averages are for each time interval: 0–10 = 4.5, 10–20 = 5.0, 20–30 = 4.7, 30–40 = 5.0, 40–50 = 6.4, and 50–60 = 6.4.

