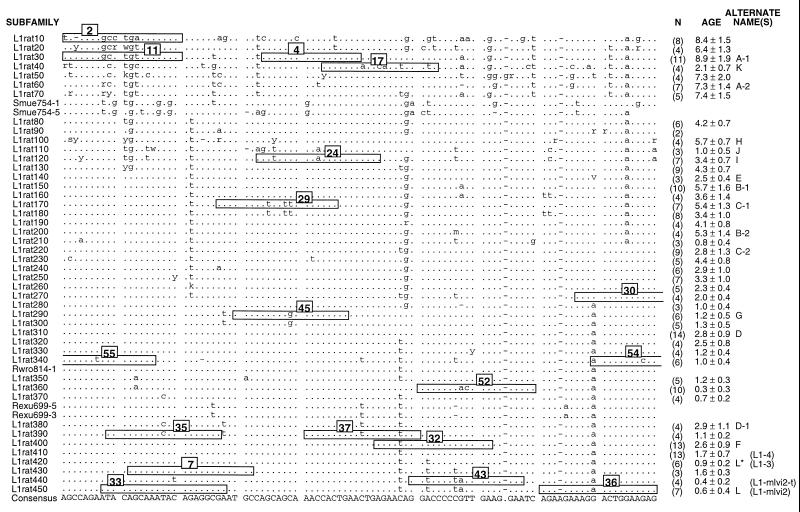
Figure 1.
Rat L1 subfamilies. This is an alignment of the consensus sequences calculated for 45 rat L1 subfamilies and the individual sequence of 5 additional L1 elements. Only 100 bp of the 215- to 320-bp region of the 3′ UTR that was sequenced is shown here. All mammalian L1 elements contain four regions: a 5′ UTR involved in regulation; ORF I, which encodes an RNA-binding protein; ORF II, which encodes a reverse transcriptase; and the 3′ UTR. As explained elsewhere, the evolution of the 3′ UTR appears to occur rapidly enough to make it a useful source of phylogenetic characters for analyzing recent or rapid speciations (4). The names of the subfamilies (or individual elements) are given on the left, and the number (N) of members of each subfamily and its approximate age (in My) are given on the right. Alternate names also are listed on the right: letters for cross-reference to Fig. 2 and in parentheses are previously used designations (e.g., refs. 6 and 19). The dots indicate identity with the consensus calculated from the listed sequences, the dashes indicate gaps, and the letters indicate differences. The numbered boxes indicate the sequence of the oligonucleotide hybridization probes derived from this part of the alignment. For oligonucleotides 55, 54, and 30, the sequence extends a few bases beyond the displayed alignment. This alignment begins at base 10 of our previously published partial alignment of this region (6).

