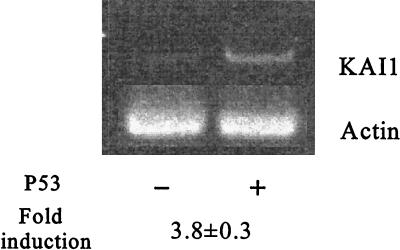
Figure 4.
Reverse transcription–PCR analysis of the expression of the endogenous KAI1 gene. The p53 expression plasmid was transfected to ALVA cells, and total RNA was isolated. mRNAs of both KAI1 and actin genes were converted to cDNA and amplified by PCR in the presence of [32P]dATP. The amount of radioactivity was quantitated by PhosphorImager, and the relative amount of KAI1 mRNA was calculated by normalizing the radioactivity to that of actin. The result was indicated as mean ± SE of three independent experiments. The photograph shows an ethidium bromide-stained gel.

