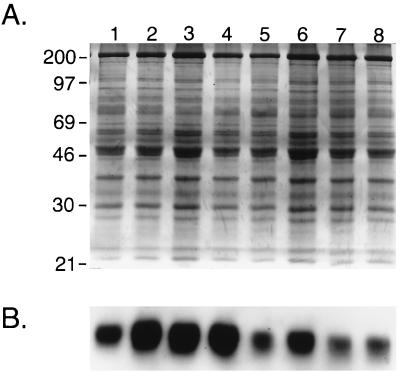
Figure 7.
Western blot analysis. Companion gels either stained with Coomassie Blue to visualize total proteins loaded (A) or further processed for immunoblotting to visualize Cx43 expression (B). The distribution of total proteins in control (lanes 1–4) and transgenic (lanes 5–8) hearts was similar, but Cx43 abundance in binary transgenic hearts was significantly reduced (n = 4 for each group; P < 0.05). This experiment was repeated in triplicate.

