Figure 3.

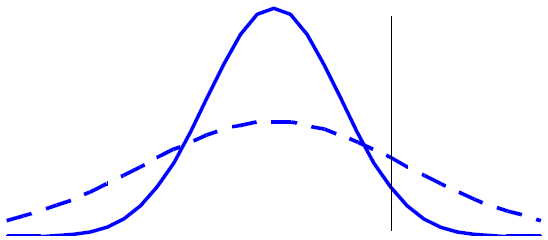
Distribution of Outcomes in the Experimental Group (Dashed Line) Has Equal Mean Value to That of the Control Group (Solid Line), But a Greater Proportion of Responders.

Distribution of Outcomes in the Experimental Group (Dashed Line) Has Equal Mean Value to That of the Control Group (Solid Line), But a Greater Proportion of Responders.