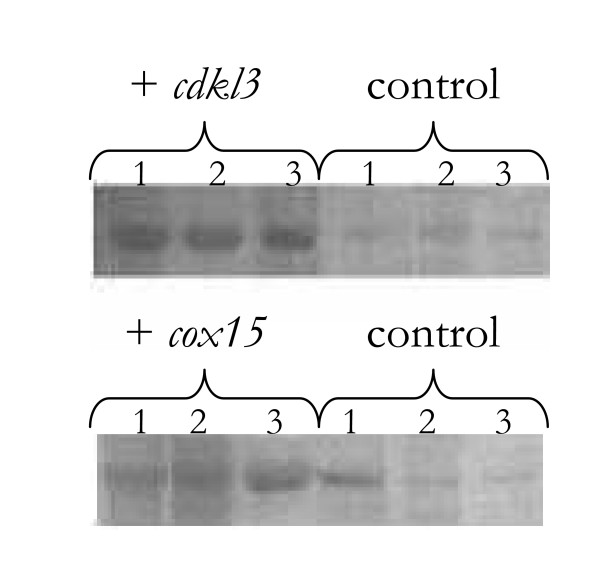
Figure 3.
Western blot analysis for several different cell lines indicating relative expression levels. These cells were derived from 3 different colonies that had already been screened and selected for expression of the transfected plasmid. At the time of analysis, these cells had been grown for over 6 days, post-transfection. The control cells were transfected with blank plasmids. 1 – HeLa 2 – HEK-293 3 – CHO

