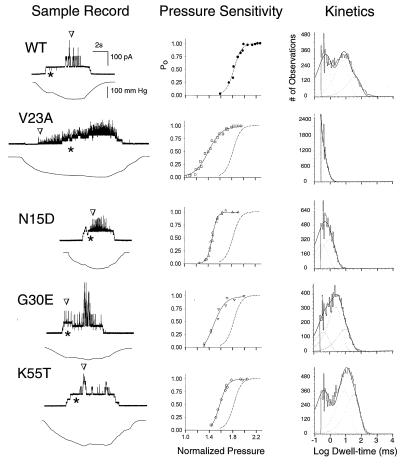
Figure 2.
MscL single-channel conductance analyses (20). Each row is from a single patch. (Left) Each panel is a representative episode of applying suction (lower trace) onto, and recording the current (upper trace) through a patch of membrane excised from a giant cell of the strain marked. Typical of >30 episodes from 10 to 50 cells of each strain. ∗, unit conductances of MscS, endogenous in all strains. ∇, of wild-type (WT) or mutant MscL conductances from plasmids. Here, pressures ranged from nil to just above the MscL thresholds, corresponding to the feet of the activation curves (Center). (Center) MscL open probability vs. suction normalized to that needed to activate MscS, i.e., MscS-threshold sets unity of the abscissa. Smooth curves are Boltzmann fits. The wild-type curve is repeated as the broken lines to ease mutant comparisons. P1/2: WT 1.9 ± 0.2 (mean ± SD, n = 4); V23A 1.4 ± 0.2* (n = 4); N15D 1.6, 1.4 (n = 2), G30E 1.5 ± 0.1** (n = 4), K55: 1.6, 1.6 (n = 2). Slope: WT: 0.08 ± 0.02; V23A 0.1 ± 0.04; N15D: 0.06, 0.04; G30E 0.09 ± 0.01; K55T 0.07, 0.08. ∗, P = 0.017; ∗∗, P = 0.007, t test against WT; all others P > 0.05; not tested where n is only 2. (Right) Open-time distribution histograms. In wild type, open dwell can be fitted with three components (24) with time constants of 38, 7, and <0.3 ms. Group 1–3 mutants showed shortened open dwell: V23A, all < 0.3 ms; N15D, 1.0 ms, and <0.3 ms; G30E, 10, 3, and <0.3 ms. K55T of Group 4 was like the wild type: 33, 8, and <0.3 ms.

