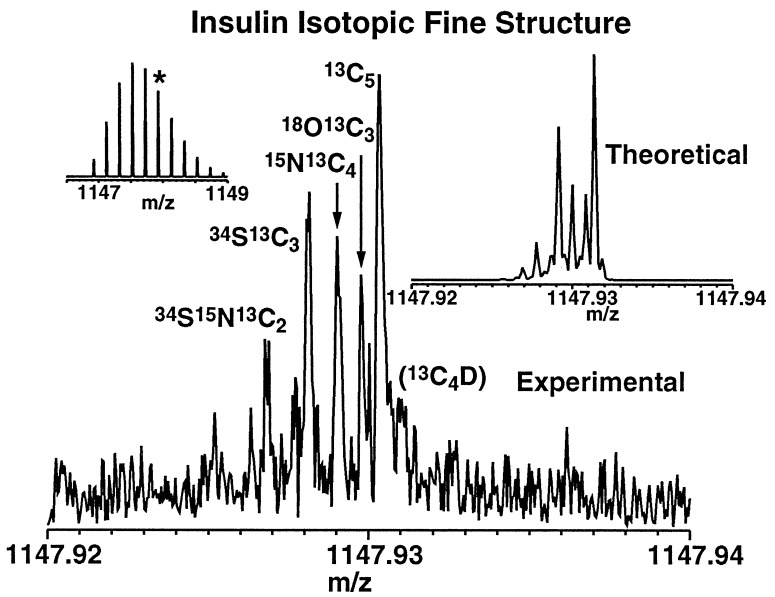
Figure 1.
ESI FT-ICR mass spectrum (Upper Left), from a single time-domain data acquisition, of bovine insulin. Theoretical (Upper Right) and experimental (Lower) isotopic fine structure is shown for the isotopic peak (★) ∼5 Da above the monoisotopic mass. Individual elemental compositions are clearly resolved at approximately correct relative abundances.

