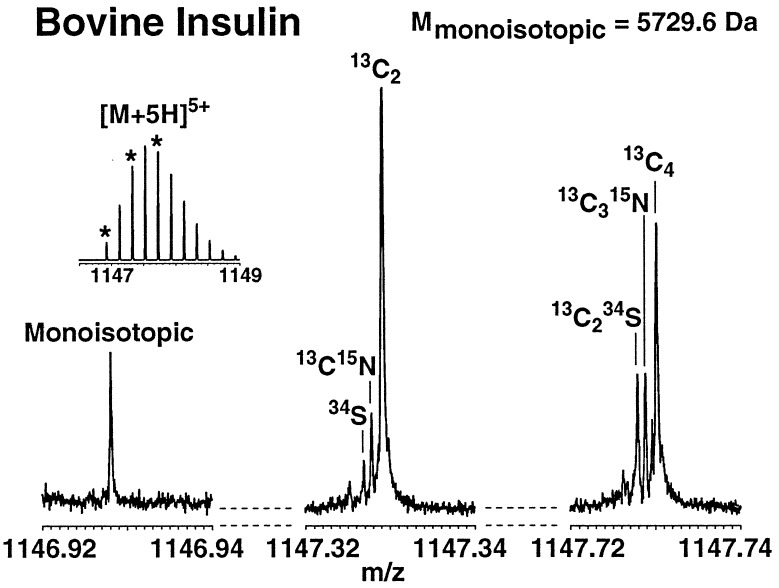
Figure 5.
Mass scale-expanded spectra of three isotopic peaks of bovine insulin, obtained by coadding 11 frequency-domain ESI FT-ICR spectra. The theoretical isotopic distribution is shown at upper left, in which ★ denote the monisotopic peak (Left), and isotopic peaks ∼2 Da (middle) and ∼4 Da (Right) above the monoisotopic mass. Note the significant improvement in SNR (compare with Fig. 1) because of frequency-domain signal averaging.

