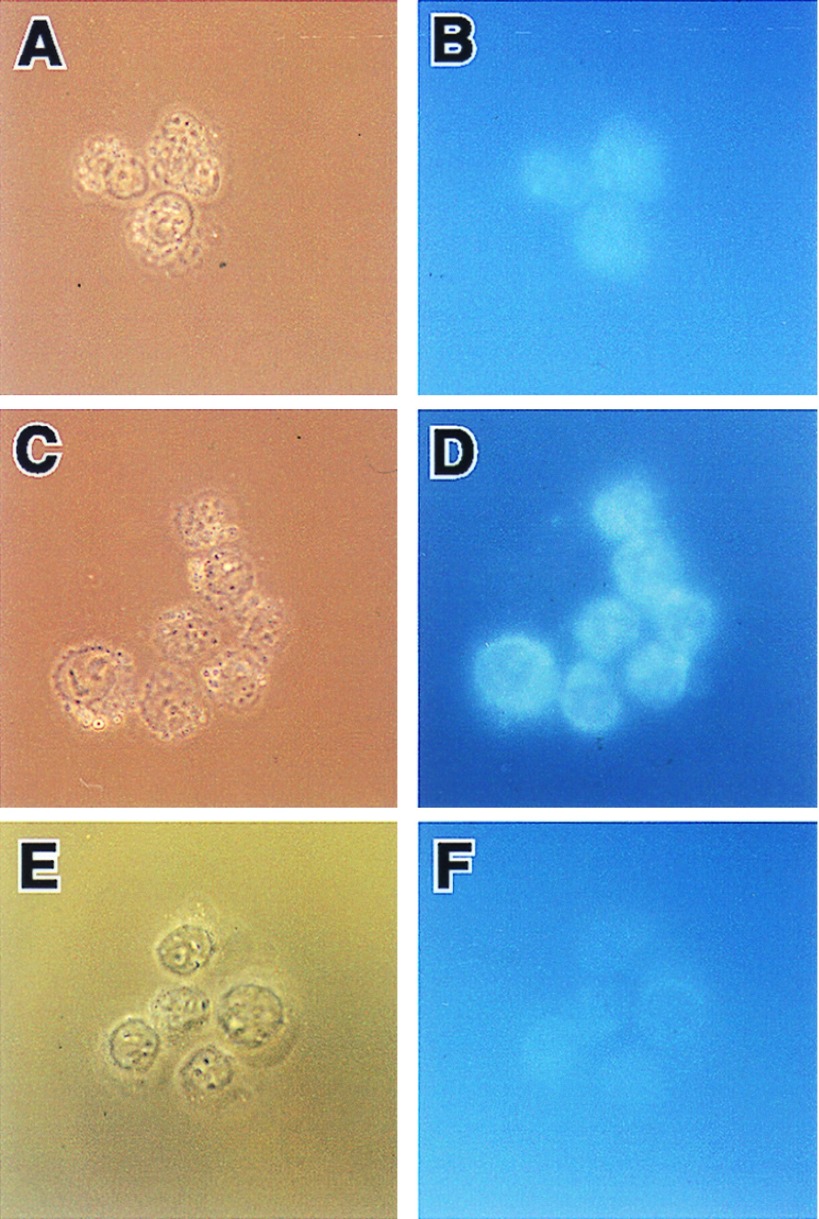
Figure 3.
Fluorescence emission of MB after microinjection into K562 hematopoietic cells. After injection of 150 μM vav AS or SCR (control) MBs into living K562 human leukemia cells, the cells were examined for signal by phase (A, C, and E) and corresponding fluorescence (B, D, and F) microscopy. Significantly higher levels of cellular fluorescence were observed in cells injected with AS MBs (C and D) than in those cells injected with SCR MBs (A and B). Uninjected cells displayed no fluorescence (E and F). A shows uninjected control cells photographed under phase microscopy; B is the corresponding fluorescent photomicrograph. C and E are AS-MB- and SCR-MB-injected K562 cells, respectively, photographed under phase microscopy, and D and F are their corresponding fluorescent counterparts, respectively. Note that maximal fluorescent emission is found in AS-MB-injected cells.

