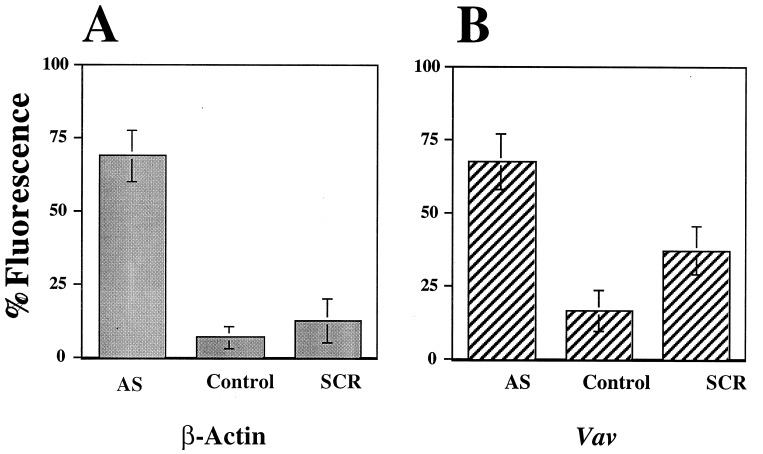
Figure 4.
Relative fluorescence intensity of molecular beacons. K562 cells were microinjected with AS-, SCR-, or NO-β-actin (A) or vav (B) MBs at 150 μM. MBs hybridized to target sequences within 14 min. Cells were then exposed to UV light by using a ×60 plan Apo numerical aperture 1.4 UV fluoride lens. Fluorescent signals were observed within 50 s, and images were captured with a KS-1381 videoscope. Fluorescence levels were measured by using cue series image analysis software with reference to uniformly dyed microspheres.

