
Fig. 6. Immunofluorescence analysis of caspase-3 expression in neurons and oligodendrocytes.
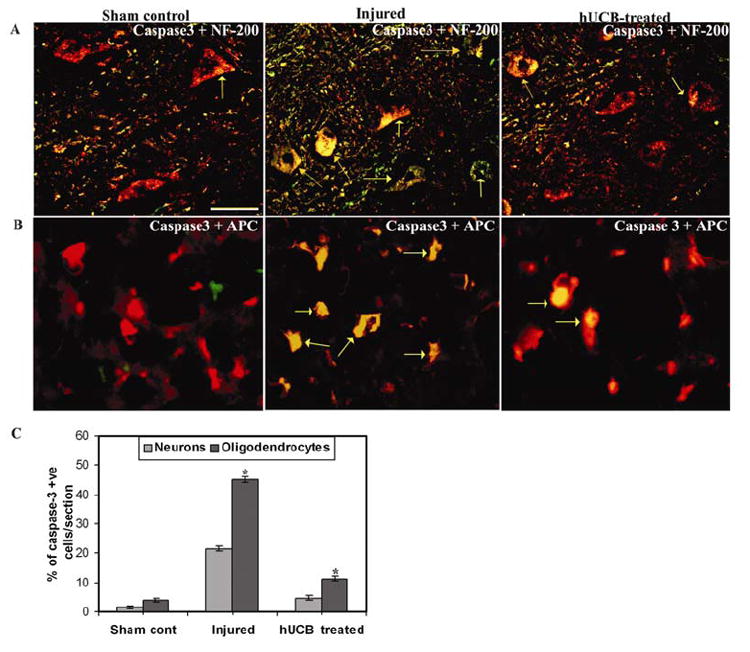
Confocal images of cryo-sections illustrate co-localization (yellow) of activated caspase-3 (FITC-conjugated) with (A) NF-200 (Texas-red conjugated) and (B) APC (Texas-red conjugated) within the dorsal region(↑), following spinal cord contusion. The tissue sections represent regions between 1 and 2 mm caudal from the lesion epicenter after 3 weeks SCI. Bar = 100 μm. (C) Quantitation of apoptotic neurons and oligodendrocytes in tissue sections. A large number of caspase-3 positive cells are present in the injured sections, whereas the hUCB-treated sections exhibit a decreasing trend of caspase-3 positive cells. Values represent mean ± SEM values of at least 3 sections with duplicates between 1 and 2 mm from the injury epicenter. * Significant at p <0.05, (n ≥ 4).