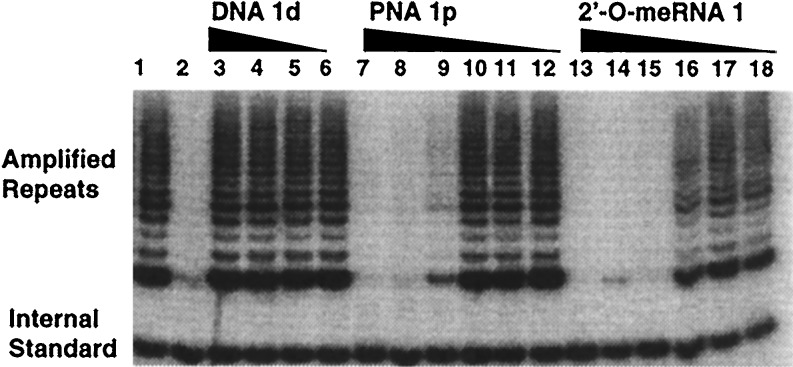
Figure 1.
Relative inhibition of analogous DNA, PNA, and 2′-O-meRNA oligomers. Inhibition was monitored as a function of the concentration of DNA 1d, PNA 1p, and 2′-O-meRNA 1. Lane 1, no inhibitor added. Lane 2, no cell lysate added. Lanes 3–6, DNA 1d added at the following concentrations: 33.3 μM, 3.33 μM, 333 nM, and 33.3 nM. Lanes 7–12, PNA 1p added at the following concentrations: 33.3 μM, 3.33 μM, 333 nM, 33.3 nM, 3.33 nM, and 333 pM. Lanes 13–18, 2′-O-meRNA 1 added at the following concentrations: 33.3 μM, 3.33 μM, 333 nM, 33.3 nM, 3.33 nM, and 333 pM.

