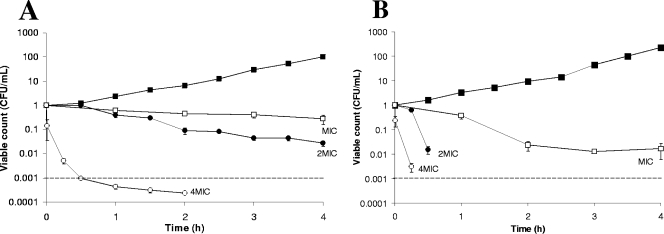
FIG. 1.
Time-kill curves of CS in MHB over a 4-h period with MRSA 101 (A) and S. aureus ATCC 29213 (B) and concentrations at MIC, 2× MIC, and 4× MIC. ▪, growth control; 2MIC, 2× MIC; 4MIC, 4× MIC; dashed lines, total kill. The experiments were conducted a minimum of three times and the results normalized. The standard error of each data point is shown.

