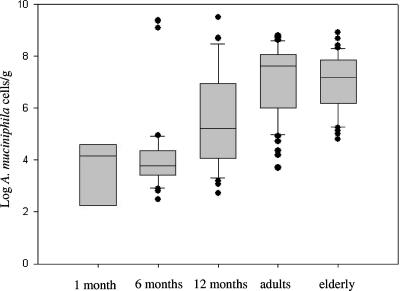
FIG. 1.
A. muciniphila levels in human fecal samples as determined by real-time PCR over a life span. Data represent the positive samples. The line in the box represents the median (50th percentile), with the lower line the 25% border (25th percentile) and the upper line the 75% border (75th percentile). The end of the upper vertical line represents the maximum data value, outliers not considered. The end of the lower vertical line represents the lowest value, outliers not considered. The separate dots indicate outliers.

