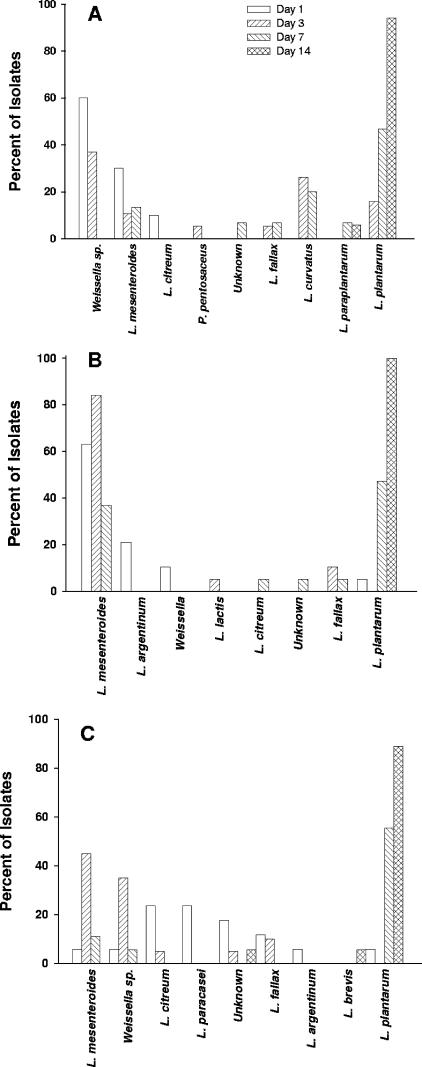
FIG. 4.
Microbial diversity of the Y2 fermentations as determined by ITS-PCR and 16S rRNA gene sequencing. The percentages of the total isolates (95, 93, 93, and 90 isolates on days 1, 3, 7, and 14, respectively) that were members of different species are indicated by the bars. The results for tank 1 (A), tank 2 (B), and tank 3 (C) are shown.

