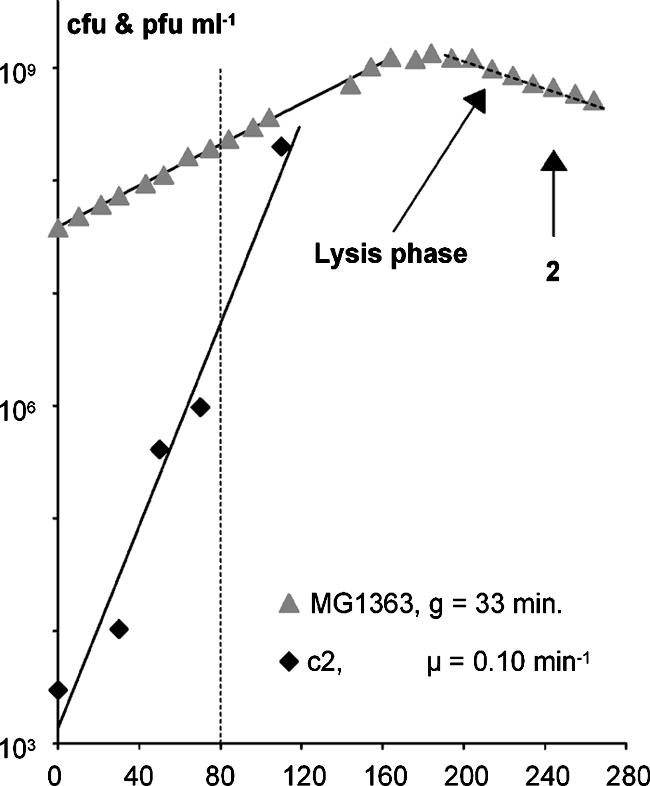
FIG. 2.

MG1363 growing in GM17 supplemented with 5 mM CaCl2 was infected with 3 × 10³ c2 phage per ml at time zero. Samples were withdrawn at different times for OD measurement, PFU, and flow cytometric analysis. The cells per ml were calculated from the OD measurements, using the factor 4.8 × 10⁸ cells per ml at an OD450 of 1. The vertical dashed line at 80 min indicates the time for the first sign of infection seen in the flow cytometer. The time for sample 2 in Fig. 3, below, is indicated by a “2.”
