
FIG. 5.
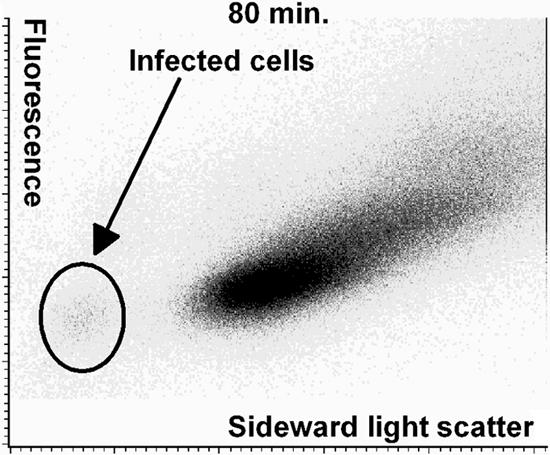
Cytogram of the first sample from the experiment shown in Fig. 2 of MG1363 cells infected with phage c2 and showing signs of infection. This sample was taken 80 min after the beginning of the infection. The cytogram shows fluorescence (DNA stain) versus sideward light scatter (size and roughness).