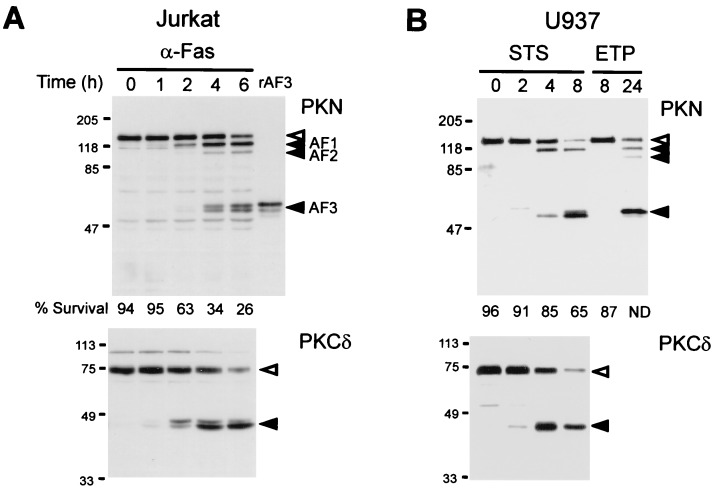
Figure 1.
Proteolytic cleavage of PKN in apoptotic cells. (A) Cleavage of PKN in Jurkat cells. Jurkat cells were treated with 150 ng/ml α-Fas mAb for the indicated time periods. (B) Cleavage of PKN in U937 cells. U937 cells were treated with 1 μM staurosporin (STS) or 10 μg/ml etoposide (ETP) for the indicated time periods. Cell lysates were subjected to immunoblot analysis with αC6 (Upper) or nPKCδ (C-20) (Lower). White and black arrowheads on the right indicate uncleaved and cleaved proteins, respectively. The cleavage products of PKN designated as AF1, AF2, and AF3 are shown with the black arrowheads in A. rAF3 indicates the recombinant AF3 expressed in COS-7 cells. Percentage of the viable cells determined by Annexin V-FITC apoptosis kit at each timepoint is given below each lane of PKN blots. ND, not determined. Molecular mass markers in kDa are indicated on the left of blots.

