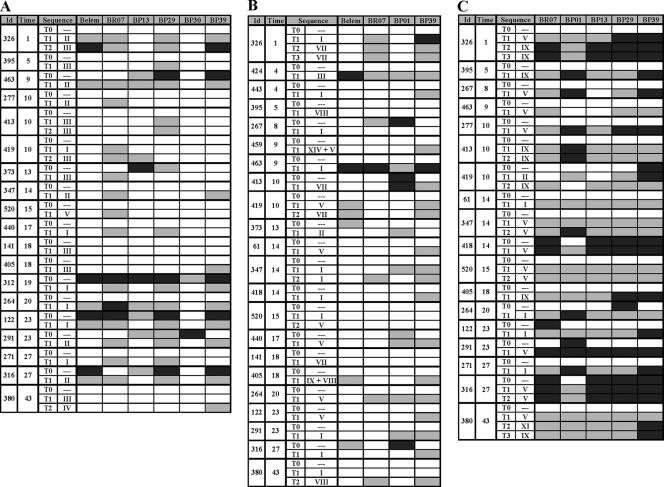
FIG. 5.
IgG antibodies to PvMSP-1 variants in sequential samples from malaria-exposed rural Amazonians. “Id” refers to the identification number of each subject, and “Time” refers to the time of residence (in years) in Amazonia, a proxy of the cumulative exposure to malaria. “Sequence” indicates the PvMSP-1 sequence type(s) detected during the acute malaria infection (numbered as in Fig. 2 [block 2], Fig. 3 [block 6], and Fig. 4 [block 10]); dashes indicate the absence of malaria parasites at the time of sample collection. T0 denotes samples collected at the study baseline in the absence of P. vivax infection; other serum samples (T1, T2, and T3) were collected during incident P. vivax episodes that had the PvMSP-1 variant present in infecting parasites characterized by DNA sequencing. Serological results for incident P. vivax infections with parasites of undetermined PvMSP-1 type are not shown. Each box represents levels of antibodies, in an individual sample, to a given antigen. Box shading is proportional to the concentration of IgG antibodies measured by ELISA; RIs between 1.1 and 1.3 are represented with light gray shading, and RIs above 1.3 are represented with dark gray shading; negative results are represented as open boxes. (A) Data for six block 2 antigens (19 subjects; 42 samples analyzed). (B) Data for four block 6 antigens (22 subjects; 49 samples analyzed). (C) Data for five block 10 antigens (18 subjects; 45 samples analyzed). Corresponding data for IgM antibodies are shown in Fig. S4 in the supplemental material.

