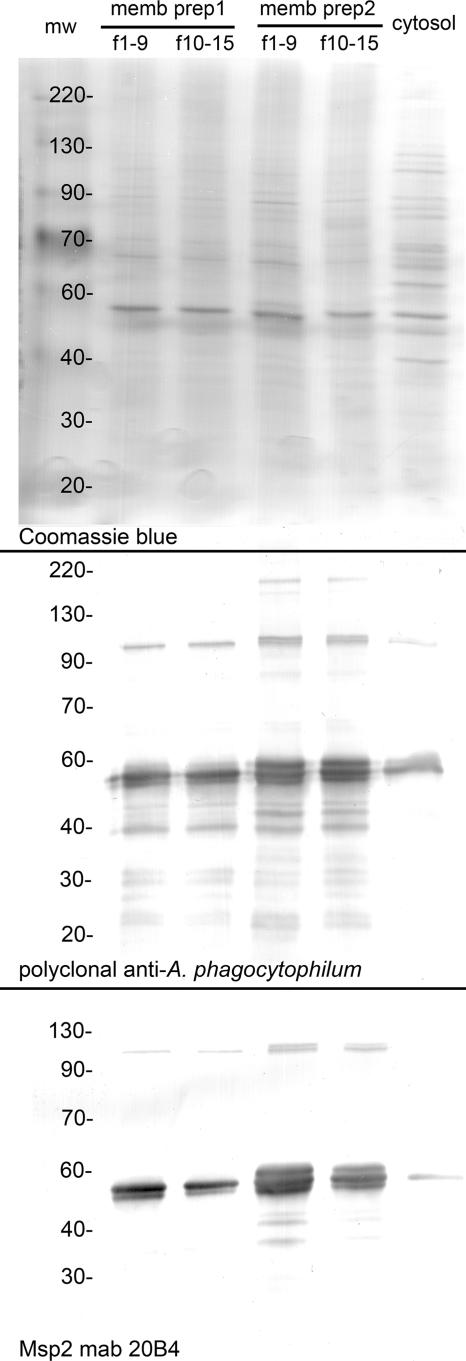
FIG. 1.
Relative distribution of proteins, antigens, and Msp2 in membrane and cytosolic fractions of A. phagocytophilum. Lanes 1 and 2 and 3 and 4 represent membrane fractions 1 to 9 (f1-9) and 10 to 15 (f10-15), respectively, from separate preparations, and lane 5 represents the pooled cytoplasmic fractions from these preparations. The top panel shows a total protein Coomassie blue stain illustrating the overall similar protein contents but dissimilar protein profiles between membranes and bacterial cytosol. The middle panel is a protein immunoblot reacted with rabbit polyclonal antibody prepared for whole, purified A. phagocytophilum strain Webster cells, again depicting the 4.1- to 5.3-fold-greater distribution of antigens into the membrane fraction. The bottom panel shows protein immunoblotting with MAb 20B4 to A. phagocytophilum Msp2 and depicts even greater (15.5- to 30.1-fold) partitioning of Msp2 into bacterial membranes than into bacterial cytosol. Molecular weights (mw) (in thousands) are shown on the left side of each panel.

