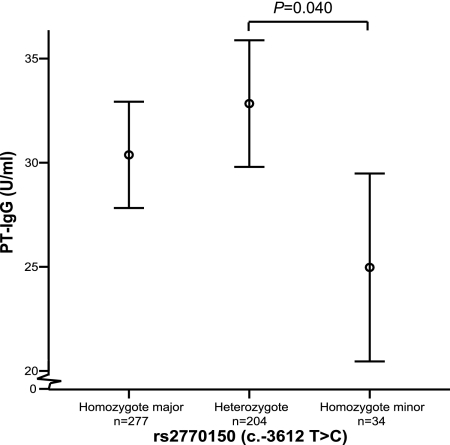
FIG. 2.
Pertussis toxin-specific IgG titer per genotype. Circles represent the means of the PT-IgG titer, and the standard deviations are represented by the vertical error bars. Horizontal lines represent a statistical difference (P < 0.05) between groups according to the least significant difference post hoc test (ANOVA, SPSS).

