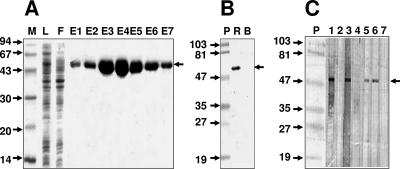
FIG. 2.
Purification and immunoblot analysis of the rEDIII-T protein. (A) SDS-PAGE analysis of Ni-NTA affinity column fractions obtained during the purification of rEDIII-T protein. The samples analyzed in the gel are load (lane L), flowthrough (lane F), and eluates (lanes E1 to E7). Protein molecular mass markers were run in lane M; their sizes in kDa are shown to the left. The arrow to the right indicates the position of the rEDIII-T protein. (B) Western blot analysis of the purified rEDIII-T protein using the penta-His MAb. An aliquot of the purified recombinant protein was run in lane R. A protein without His tag (bovine serum albumin) was run in lane B as a negative control. Prestained protein molecular mass markers were run in lane P; their sizes in kDa are shown to the left. The arrow to the right indicates the position of the rEDIII-T protein. (C) Western blot analysis performed with nitrocellulose strips onto which purified rEDIII-T protein had been transferred after SDS-PAGE. The test strips were probed with IgM+ IgG− (lanes 1 and 4) or IgM− IgG+ (lanes 2 and 3) confirmed DEN patient sera. The penta-His MAb (lane 6), murine anti-rEDIII-T polyclonal serum (lane 5), and murine preimmune serum (lane 7) were used to probe the control strips. The rEDIII-T protein was visualized using anti-human IgM (lanes 1 and 2)-, anti-human IgG (lanes 3 and 4)-, or anti-murine IgG (lanes 5 to 7)-enzyme conjugate. Prestained molecular mass markers were run in lane P; their sizes in kDa are indicated to the left. The arrow to the right indicates the position of the rEDIII-T antigen.

