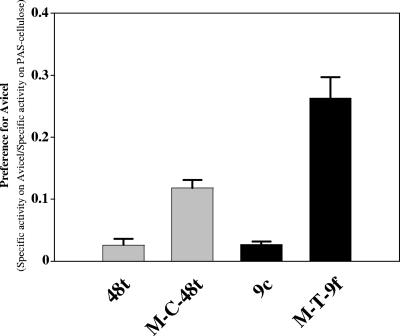
FIG. 3.
Preference of parental versus engineered enzymes for Avicel over PAS-cellulose. The enzymes are indicated at the bottom of the graph. The data represent the ratio of the specific activity on Avicel/specific activity on PAS-cellulose. The specific activity on Avicel was estimated after 24 h of hydrolysis (data from Fig. 2). The standard deviations are indicated by the error bars.

